Optimizing machine learning-based classification of cardiac
arrhythmias through feature selection
Seyed Ali Fatemi Aghda1,2 , Arezoo
Abasi1*
, Arezoo
Abasi1*
1Student
Research Committee, Iran University of Medical Sciences, Tehran, Iran
2Research Center for
Health Technology Assessment and Medical Informatics, School of Public Health,
Shahid Sadoughi University of Medical Sciences, Yazd, Iran
|
Article Info
|
A B S T R A C T
|
|
Article type:
Research
|
Introduction:
The clinical complexity of cardiac arrhythmias drives the adoption of Machine
Learning (ML) for diagnosis. However, model efficacy critically depends on
identifying the most predictive features. This study investigates advanced
feature selection methods to isolate optimal parameters, aiming to enhance
the accuracy and efficiency of arrhythmia classification models. Using
optimal feature selection, this study identifies key Electrocardiogram
(ECG) and clinical predictors to enhance ML model accuracy in detecting
cardiac arrhythmias.
Material and
Methods: This computational study employed a two-phase feature
refinement using Correlation Feature Selection (CFS) with Best-First Search,
distilling best 50 features and 27 elite predictive features from global and
localized ECG characteristics. Multiple machine learning models were then
developed and assessed based on this optimized feature set.
Results: The
results demonstrated significant improvements in classification accuracy with
feature selection. Random forest achieved an accuracy of 69.46% without
feature selection, which increased to 73.67% with the top 50 features and
further improved to 75.66% with the elite features. Similarly, LogitBoost
showed a remarkable increase in accuracy from 74.55% to 80.97% when using the
elite features.
Conclusion: Considering
the increase in cardiac diseases and their treatment costs, finding the most
important features and using Artificial Intelligence
(AI) will improve the screening and diagnosis of these patients. Also,
electronic health record data and the design of medical decision support
systems can be helpful in helping to treat and improve patient management.
|
|
Article
History:
Received: 2026-01-21
Accepted: 2026-02-21
Published: 2025-03-11
|
|
* Corresponding
author:
Arezoo Abasi
Student Research Committee, School of Health
Management and Information Sciences, Iran University of Medical Sciences,
Tehran, Iran
Email: abasi.arezoo@gmail.com
|
|
Keywords:
Cardiac Arrhythmias
Machine Learning Algorithms
Classification
Feature Selection
Electrocardiography
|
|
Cite this paper as:
Fatemi Aghda SA, Abasi A. Optimizing machine
learning-based classification of cardiac arrhythmias through feature
selection. Adv Med Inform. 2026; 2: 10.
|
Introduction
Despite notable advancements in
medical technology and improved prognostic outcomes, cardiovascular diseases
(CVDs) remain among the leading causes of mortality worldwide. Cardiac
disease refers to a broad spectrum of conditions that affect the structure and
function of the heart [1]. It remains a major global
health concern with substantial clinical and economic implications. Early
diagnosis and prompt medical intervention play a crucial role in decreasing
mortality associated with conditions such as myocardial infarction and sudden
cardiac death [2].
The diverse range of modifiable and non-modifiable risk
factors linked to cardiac disease is primarily grounded in empirical clinical
evidence. These factors are generally categorized into social determinants such
as educational attainment, health literacy, and access to healthcare, as well
as biological and behavioral determinants including age, lifestyle habits,
comorbidities, and individual behaviors [3-5].
CVD remains the foremost cause of mortality globally. Its
prevalence and associated death rates have risen significantly over recent
decades, from 271 million cases and 12.1 million deaths in 1990 to 523 million
cases and 18.1 million deaths by 2019. Projections indicate that CVD-related
deaths may reach 23.6 million by 2030 [6,
7].
Furthermore, projections from 2010 estimated that the
global cost of treating CVDS would rise from 863 billion USD to approximately
1.044 trillion USD by 2030. In response, the application of Artificial
Intelligence (AI) in screening, diagnosis, and treatment has been increasingly
recognized as a promising strategy to reduce both the prevalence and economic
burden of CVDS [8].
AI is a rapidly evolving field that has become embedded
in many aspects of modern life. The rapid advancement of
computational technologies and the growing availability of digital data have
significantly contributed to the progress of AI. Over the past decade, machine
learning techniques have seen widespread adoption across numerous medical
disciplines, including cardiology [9, 10]. Cardiology is a key area for AI application, as
treatment decisions rely heavily on digital patient data and various diagnostic
tests. AI algorithms excel at processing and analyzing large volumes of
clinical information with a speed and accuracy that surpass human capabilities
[11]. Machine Learning (ML) presents promising
opportunities to enhance the screening and prevention of CVDS. As AI continues
to integrate into medicine, it is expected to significantly augment doctors'
capabilities, improving efficiency and productivity. Among cardiac conditions,
arrhythmias involve disturbances in cardiac rhythm that manifest in diverse
clinical forms. Advances in diagnostic technologies have considerably improved
the detection of arrhythmias [12, 13].
The Electrocardiogram (ECG) is widely
regarded as the most straightforward and dependable method for diagnosing these
conditions [14]. Clinicians can extract key parameters,
including the P wave, QRS complex, ST segment, T wave, and U wave, from
standard 12-lead ECG recordings to identify irregularities. Yet,
manually reviewing long-duration ECG recordings for subtle abnormalities
remains time-consuming and prone to observer variability [15]. Automatic detection of arrhythmias from ECG
recordings is essential for accurate clinical diagnosis and treatment. ML
techniques have proven to be valuable in this area, facilitating
the automated and precise identification of cardiac arrhythmias [9].
Unlike prior studies that typically apply
feature selection in a single phase or evaluate only a limited number of models,
this research proposes a systematic multi-stage CFS-based feature
selection framework with fold-based analysis to capture the most
consistent and informative ECG parameters. The study also offers a
comprehensive comparison of classifier performance across three progressive
feature selection scenarios (including no selection, best 50 features, and
elite 27 features) thereby establishing a reproducible and fine-tuned pipeline
for arrhythmias classification that is both interpretable and performance-driven.
Although the global burden of CVDS continues to rise,
arrhythmias constitute a clinically important subgroup due to their diagnostic
complexity and potential for severe outcomes. The complexity of
arrhythmia, influenced by numerous factors, creates challenges in analyzing
extensive data and can lead to confusion in diagnosis and treatment. In
contrast, the integration of AI and ML across various clinical applications in cardiology, including
screening, diagnosis, and treatment, has garnered considerable attention. Since
most cardiac arrhythmias data is electronically recorded and influenced by
multiple factors, this study employed the CFS method to identify the most
relevant features for diagnosing arrhythmia. Across three feature
selection scenarios, multiple ML models were developed, analyzed, and
rigorously evaluated.
Material and Methods
The data set
This computational, retrospective, machine learning–based
analytical study utilized the publicly available Cardiac Arrhythmia dataset
from the UCI Machine Learning Repository [16]. The dataset contains ECG recordings from 452 patients, each
represented by 279 attributes, of which 206 are continuous and 73 are
categorical or binary. These features represent cardiac electrical activity
across 12 standard ECG leads, including time intervals (QRS duration, PR
interval), amplitude values of P, Q, R, S, and T waves, and derived attributes
such as QRSTA and RR interval variability.
The dataset includes 16 classification categories, with
Class 01 representing normal ECG findings and Classes 02 to 15 corresponding to
specific arrhythmia types, such as atrial flutter, ventricular tachycardia,
left bundle branch block, and supraventricular arrhythmias. Class 16 includes
patients whose ECG recordings could not be reliably assigned to a specific
category. Each class label is determined based on the interpretation of ECG
signals by expert cardiologists, following clinical diagnostic standards.
However, due to class imbalance and the diagnostic complexity of arrhythmia
types, many studies (including ours) consolidate the multiclass output into a
binary classification framework, distinguishing normal (Class 01) from
abnormal/arrhythmic (Classes 02–16) ECGs. This binary approach facilitates
early screening and simplifies performance evaluation while maintaining
clinical relevance. Table 1 demonstrates the description of types of
arrhythmias.
Feature selection method
Feature selection, also known as variable or attribute
selection, differs from dimensionality reduction, which reduces dimensionality
by generating new feature combinations [17]. The main goal of feature selection is to identify
and eliminate unnecessary, irrelevant, and redundant features in order to
enhance classification accuracy.
Table 1: Description of types of arrhythmias
and class labels
|
Number of instances
|
Class Name
|
Class Label
|
|
245
|
Normal ECG
|
01
|
|
44
|
Ischemic changes
|
02
|
|
15
|
Old anterior myocardial
infarction
|
03
|
|
15
|
Old inferior myocardial
infarction
|
04
|
|
13
|
Sinus tachycardia
|
05
|
|
25
|
Sinus bradycardia
|
06
|
|
3
|
Ventricular Premature
Contraction
|
07
|
|
2
|
Supraventricular
Premature Contraction
|
08
|
|
9
|
Left bundle branch block
|
09
|
|
50
|
Right bundle branch block
|
10
|
|
0
|
1-degree Atrioventricular
block
|
11
|
|
0
|
2-degree AV block
|
12
|
|
0
|
3-degree AV block
|
13
|
|
4
|
Left ventricular
hypertrophy
|
14
|
|
5
|
Atrial Fibrillation or
Flutter
|
15
|
|
22
|
Others
|
16
|
Abbreviations: ECG,
Electrocardiogram; MI, Myocardial Infarction; VPC, Ventricular Premature
Contraction; SVC, Supraventricular Premature Contraction; LBBB, Left Bundle
Branch Block; RBBB, Right Bundle Branch Block; AV, Atrioventricular; LVH, Left
Ventricular Hypertrophy.
Feature selection techniques are generally classified into
three main categories based on their approach and how they interact with model
development: Filter Methods, Wrapper Methods, and Embedded Methods [18]. Each of these methods
presents distinct benefits and is applicable to different situations.
In this study, we selected the CFS method with Best-First
Search (BFS) due to its proven efficiency in reducing feature redundancy while
preserving high predictive value. CFS evaluates feature subsets based on both
relevance to the target class and inter-feature correlations, making it
well-suited for biomedical datasets where many attributes may be collinear or
weakly informative. Moreover, BFS offers a practical heuristic for exploring
the search space without exhaustive computation, enabling scalability for
high-dimensional datasets.
Rationale for the multi-phase CFS procedure
Our three-phase CFS approach was designed to ensure
comprehensive feature exploration by iteratively removing highly correlated
features and re-evaluating the remaining ones. This method allows for the
identification of both globally dominant and locally nuanced ECG
characteristics. By removing the most influential features from the first and
second steps, we force the algorithm to identify additional meaningful features
that might have been initially overshadowed by highly correlated or dominant
attributes. Moreover, each phase provides an opportunity to observe feature
selection stability across folds, ensuring robust feature selection.
The CFS algorithm evaluates feature subsets based on
Pearson correlation between features and the class, with a merit threshold set
to accept subsets that improve predictive correlation while reducing
inter-feature redundancy. The BFS was configured with a forward search
direction, allowing up to 5 consecutive non-improving nodes before termination,
and a cache size of 5 to balance exploration and computation time.
Selection criteria for elite features
The elite features were selected from the initial 50 best
features using two-stage criteria of Fold Consistency and CFS Subset
Evaluation. We ranked the 50 features by their selection frequency across
10-fold cross-validatio. Only features selected in at least 3 folds were
retained. We re-applied CFS to this filtered set, which yielded 27 features
that maximized the subset merit score (correlation with class minus
inter-feature correlation). This dual-criteria approach ensured both stability
(fold consistency) and optimal subset relevance (CFS merit).
Learning algorithms and approach assumption
Upon consolidation into a binary framework, the dataset
comprised 245 normal ECGs (Class 01) and 207 abnormal ECGs (Classes 02–16),
representing a moderate class distribution (54.2% normal vs. 45.8% abnormal). Model
performance was evaluated using stratified 10-fold cross-validation to ensure
robustness and fair comparison across classifiers. Given the moderate class
imbalance in the dataset, stratified cross-validation was employed to preserve
the original class distribution across training and test folds. No resampling
was performed on test data. Performance metrics were averaged across all five
independent splits to ensure stability and reliability.
The rationale for selecting a diverse set of classifiers
lies in their complementary strengths. Random forest was chosen for its
resilience to overfitting and strong performance on tabular biomedical data.
LogitBoost was selected for its boosting mechanism that can handle complex
decision boundaries. Bayes Net was included for its probabilistic interpretability,
which is particularly useful in medical settings. Additional classifiers such
as Support Vector Machine (SVM), decision tree, K-nearest neighbors (KNN), and
ensemble methods (voting, AdaBoost, bagging, and stacking) were evaluated to
ensure a comprehensive comparison across different algorithm families,
probabilistic, tree-based, kernel-based, and ensemble techniques.
We compared the performance of several classifiers,
including Bayes net, SVM, random forest (with 10 and 40 trees), LogitBoost (with
decision stump), voting, AdaBoost (with random forest), and bagging (with random
forest). Additionally, two versions of the voting classifier were developed:
Vote-1, which included Bayes net, SVM, random forest (40 trees), and LogitBoost
(decision stump), and Vote-2, which included Bayes net, random forest (40
trees), and LogitBoost (decision stump).
Brief and comparative overview of ML algorithms
In this study, a wide range of ML classifiers was used to
evaluate the impact of feature selection on the classification of cardiac
arrhythmias. These algorithms were selected based on their popularity in
biomedical domains and their diverse methodological foundations.
Tree-based classifiers such as decision tree, J48 tree, random
tree, and random forest are well-known for their interpretability and ability
to model non-linear relationships. Random forest offers strong generalization
performance through ensemble averaging but may be less transparent than
single-tree models like J48.
Boosting methods (AdaBoost, LogitBoost) aim to improve
classification accuracy by iteratively correcting the errors of weak learners
such as decision stumps or random trees. While boosting can significantly
improve performance on imbalanced or noisy datasets (as is common in ECG data),
it may risk overfitting if not properly tuned.
Bagging-based methods (Bagging with random forest, Naïve
Bayes, reduced error pruning (REP) tree, and SVM) enhance stability and reduce
variance by training multiple models on different subsets of the data. These
are particularly beneficial when base learners are prone to overfitting.
Bayesian classifiers, including Naïve Bayes, kernel Naïve
Bayes, and Bayes net, provide probabilistic outputs and are computationally
efficient. Naïve Bayes assumes feature independence, which may not be held in
ECG data, whereas Bayes Net captures dependencies between variables but
requires more complex structure learning.
Instance-based algorithms like KNN and K* rely on
distance metrics to classify new observations. These can capture complex
decision boundaries but are sensitive to irrelevant features and data scaling,
hence their performance typically improves after feature selection.
SVM is effective in high-dimensional spaces and is robust
to overfitting, especially with proper kernel selection. However, it can be
computationally intensive and sensitive to parameter settings, particularly in
multiclass scenarios like arrhythmia classification. Rule-based classifiers
such as Rule Induction and decision table generate human-readable rules,
offering interpretability that is valuable in clinical decision-making.
Hoeffding tree, a stream-based decision tree model, and Stacking ensembles
(with different base learners including SVM, random forest, and ZeroR) were
also employed to explore performance diversity. While stacking has the
potential to leverage complementary strengths of base models, its success is
highly dependent on the choice and interaction of these components. Poor
performance likely reflects limited sample size and overfitting in
meta-learners.
Performance evaluation
Feature selection protocol
Our multi-phase feature selection process involved two
main stages:
Stage 1: Identification of 50 best features (Three-phase
CFS procedure)
We implemented a three-phase CFS protocol to identify the
50 most relevant features:
1. Phase 1: Apply CFS with BFS to the full dataset; retain top
20 features (selected in ≥8 folds).
2. Phase 2: Remove Phase 1 features; re-run CFS on remaining
259 features; retain next 20 features.
3. Phase 3: Remove all 40 previously selected features; run
CFS on remaining 239 features; retain top 10 features.
Stage 2: Refinement to 27 elite features
From the 50 best features, we applied a two-stage
refinement:
1. Fold consistency filtering: Retain only features selected
in ≥3 folds during 10-fold cross-validation.
2. CFS subset optimization: Re-apply CFS to this filtered set,
yielding 27 elite features that maximized the subset merit score.
Classification Scenarios
We evaluated classifier performance across three progressively
refined feature sets:
Scenario 1: No feature selection (Baseline)
Classification was performed using all 279 original
features, serving as the baseline performance.
Scenario 2: 50 Best features
Classification was performed using the 50 features
identified through the three-phase CFS procedure.
Scenario 3: 27 Elite features
Classification was performed using the refined set of 27
elite features.
Following feature selection, several machine learning
algorithms, including decision tree, random forest, KNN, SVM, random tree,
AdaBoost, bagging, and stacking, were applied to compare and evaluate the
performance of each scenario.
Results
Our primary objective was to identify the attribute
evaluator that yielded the highest classification accuracy across the tested
models. The outcomes of the experiment are summarized in Table 2, which
provides a comparative assessment of the performance of the evaluated methods.
Table 2: Accuracy of each classifier by the
attribute evaluators and its search method
|
Attribute Evaluator
|
Search Method
|
Selection Mode
|
Classifiers
|
|
Logitboost
|
Random Forest
|
Bayes Net
|
|
Gain Ration
|
Ranker
|
Cross Validation - 10 fold
|
70.57
|
69.02
|
70.35
|
|
Chi Squared
|
Ranker
|
Cross Validation - 10 fold
|
74.55
|
71.46
|
71.23
|
|
Consistency Subset
|
BFS
|
Cross Validation - 10 fold
|
72.78
|
70.35
|
72.56
|
|
Filtered Method
|
Ranker
|
Cross Validation - 10 fold
|
72.34
|
70.35
|
71.68
|
|
Info Gain
|
Ranker
|
Cross Validation - 10 fold
|
72.34
|
70.35
|
71.68
|
|
OneR
|
Ranker
|
Cross Validation - 10 fold
|
73.23
|
69.02
|
70.35
|
|
ReliefF
|
Ranker
|
Cross Validation - 10 fold
|
70.79
|
71.90
|
68.58
|
|
CFS Subset
|
BFS
|
Cross Validation - 10 fold
|
75.44
|
71.68
|
75.66
|
Abbreviations: BFS,
Best-First Search; CFS, Correlation-based Feature
Selection.
Based on the accuracy percentages achieved by the
classifiers, CFS emerged as the most effective attribute evaluator compared to
the others. CFS is an algorithm that integrates a feature evaluation formula
with an appropriate correlation measure and a heuristic search strategy,
enabling the efficient selection of feature subsets by balancing relevance and
redundancy.
For classification tasks in ML, feature selection can be
effectively performed by evaluating the correlation between features. This
approach has proven beneficial for various ML algorithms, as it reduces noise
and enhances classification accuracy. CFS evaluates a subset of attributes by
considering both the individual predictive power of each feature and the level
of redundancy among them.
Subsequently, classification and feature selection were
conducted on the entire Arrhythmia dataset without any restrictions, serving as
the baseline for classification. Additionally, based on CFS, two feature
selection scenarios were implemented, with the steps and results outlined as
follows:
Scenario 1: Baseline (No FS)
This scenario was conducted in three sequential phases:
Phase 1: Initial feature selection
In the first phase, we applied the CFS feature selection
filter method combined with the BFS search technique to the dataset. This
resulted in the selection of 20 features, based on the number of folds. The
selected features and their corresponding attribute indices are presented in
Table 3. The column labeled ‘Number of folds (%)’ represents how frequently
each feature was selected across the 10-fold cross-validation process. For
instance, 10 means that the feature was selected in all 10 folds, indicating
high selection consistency and potential relevance to the classification task.
Phase 2: Refined feature selection
In the second phase, we removed the 20 features
identified in the first phase from the dataset and repeated the feature
selection process. This led to the identification of another set of 20 top
features, as detailed in (Table 3).
Phase 3: Final feature selection
In the third phase, we removed all 40 features selected
in the previous phases, leaving 239 features in the dataset. The feature
selection process was conducted again, resulting in the identification of the
top 10 features, as shown in (Table 3).
After the final selection stage, the remaining 229
features were removed, leaving a refined subset of 50 high-value features.
Classification was then performed using these 50 top features, and the model's
accuracy was calculated, ensuring that the selected features contributed
effectively to the classification task.
Scenario 2: Best selected features
In the elite stage, the feature selection process was
further refined by applying the CFS method to the previously selected 50 best
features. The objective was to identify the most significant attributes, which
we termed "elite features," to achieve optimal classification
accuracy. This process led to the selection of 27 elite features from the
original 50, representing the most relevant attributes for the classification
task (Table 4).
Scenario 3: Elite selected features
The 27 elite features were selected based on their
contribution to the classification task, ensuring maximal relevance while
minimizing redundancy. By focusing on these key attributes, we aimed to improve
the efficiency and effectiveness of the classification model.
Table 3: Top features selected through CFS methodology
|
Selection Step
|
Number of Folds (%)
|
Attribute
|
Attribute Number
|
|
Top 20 features selected in the
first step
|
10 (100)
|
QRS duration
|
5
|
|
10 (100)
|
Tinterval
|
8
|
|
10 (100)
|
T
|
11
|
|
10 (100)
|
Heartrate
|
15
|
|
10 (100)
|
chDIII_Qwave
|
40
|
|
10 (100)
|
chAVF_Qwave
|
76
|
|
10 (100)
|
chV1_intrinsicReflections
|
93
|
|
10 (100)
|
chV2_RPwave
|
103
|
|
10 (100)
|
chV3_Qwave
|
112
|
|
10 (100)
|
chV3_Swave
|
114
|
|
10 (100)
|
chAVR_JJwaveAmp
|
190
|
|
10 (100)
|
chV1_RPwaveAmp
|
224
|
|
10 (100)
|
chV1_QRSA
|
228
|
|
10 (100)
|
chV3_TwaveAmp
|
247
|
|
9 (90)
|
Q-Tinterval
|
7
|
|
9 (90)
|
chV6_QRSTA
|
279
|
|
9 (90)
|
chV6_TwaveAmp
|
277
|
|
8 (80)
|
chV2_Qwave
|
100
|
|
8 (80)
|
chV3_DD_RPwaveExists
|
121
|
|
8 (80)
|
chV5_TwaveAmp
|
267
|
|
Top 20 features selected in the
second step
|
10 (100)
|
chV1_RPwave
|
91
|
|
10 (100)
|
chV2_Swave
|
102
|
|
10 (100)
|
chDI_TwaveAmp
|
167
|
|
10 (100)
|
chDII_TwaveAmp
|
177
|
|
10 (100)
|
chV6_JJwaveAmp
|
270
|
|
10 (100)
|
chV4_TwaveAmp
|
257
|
|
10 (100)
|
chAVR_TwaveAmp
|
197
|
|
10 (100)
|
chAVR_QRSTA
|
199
|
|
9(90)
|
Sex
|
2
|
|
9 (90)
|
chV4_Swave
|
126
|
|
9 (90)
|
chV5_QRSTA
|
269
|
|
9 (90)
|
chAVF_QwaveAmp
|
211
|
|
9 (90)
|
chV2_RPwaveAmp
|
234
|
|
9 (90)
|
chV3_JJwaveAmp
|
240
|
|
9 (90)
|
chV3_QwaveAmp
|
241
|
|
8 (80)
|
chV3_SwaveAmp
|
243
|
|
8 (80)
|
chV3_QRSA
|
248
|
|
8 (80)
|
chV3_QRSTA
|
249
|
|
7 (70)
|
chDII_QwaveAmp
|
171
|
|
6 (60)
|
chDIII_QwaveAmp
|
181
|
|
Top 10 features selected in the
third step
|
10 (100)
|
chV3_Rwave
|
113
|
|
9 (90)
|
chDII_intrinsicReflections
|
33
|
|
9 (90)
|
chAVR_DD_RPwaveExists
|
61
|
|
9 (90)
|
chAVL_TwaveAmp
|
207
|
|
9 (90)
|
chV2_QRSA
|
238
|
|
9 (90)
|
chV4_QRSTA
|
259
|
|
8 (80)
|
chDII_Qwave
|
28
|
|
8 (80)
|
chV5_JJwaveAmp
|
260
|
|
7 (70)
|
chV1_DD_RRwaveExists
|
95
|
|
7 (70)
|
chV2_QwaveAmp
|
231
|
Table 4: Top 27 elite features
|
Number of folds (%)
|
Attribute
|
Attribute Number
|
|
10 (100)
|
QRSduration
|
5
|
|
10 (100)
|
Tinterval
|
8
|
|
10 (100)
|
T
|
11
|
|
10 (100)
|
Heartrate
|
15
|
|
10 (100)
|
chDIII_Qwave
|
40
|
|
10 (100)
|
chAVF_Qwave
|
76
|
|
10 (100)
|
chV1_intrinsicReflections
|
93
|
|
10 (100)
|
chV2_RPwave
|
103
|
|
10 (100)
|
chV3_Swave
|
114
|
|
10 (100)
|
chV1_QRSA
|
228
|
|
9 (90)
|
chAVR_JJwaveAmp
|
190
|
|
9 (90)
|
chV1_RPwaveAmp
|
224
|
|
9 (90)
|
Q-Tinterval
|
7
|
|
9 (90)
|
chV6_QRSTA
|
279
|
|
9 (90)
|
chV4_TwaveAmp
|
257
|
|
9 (90)
|
chV3_Qwave
|
112
|
|
8 (80)
|
chV3_TwaveAmp
|
247
|
|
8 (80)
|
chV6_TwaveAmp
|
277
|
|
7 (70)
|
chV2_Swave
|
102
|
|
6 (60)
|
chV2_Qwave
|
100
|
|
6 (60)
|
chV3_QRSA
|
248
|
|
5 (50)
|
chV3_DD_RPwaveExists
|
121
|
|
5 (50)
|
chV5_TwaveAmp
|
267
|
|
4 (40)
|
chDII_QwaveAmp
|
171
|
|
3 (30)
|
chAVR_QRSTA
|
199
|
|
3 (30)
|
chAVF_QwaveAmp
|
211
|
|
3 (30)
|
chV6_JJwaveAmp
|
270
|
Subsequently, several ML algorithms were applied to each
scenario, and their accuracy results were calculated (Table 5).
Table 5: Classification accuracy of various
algorithms for 3 scenarios
|
Classifier
|
Without feature selection
|
Best features
|
Elite features
|
|
Decision
tree
|
69.49
|
69.73
|
71.93
|
|
Random forest
|
69.46
|
73.67
|
75.66
|
|
KNN
|
60.41
|
64.61
|
65.51
|
|
Naïve Bayes
|
62.38
|
69.91
|
70.13
|
|
Bayes net
|
69.91
|
72.78
|
76.47
|
|
Decision stump
|
59.74
|
59.74
|
59.74
|
|
Rule induction
|
59.51
|
62.60
|
62.42
|
|
Naïve Bayes (kernel)
|
75.71
|
75.66
|
74.67
|
|
SVM (Lib)
|
71.24
|
70.35
|
66.17
|
|
Hoeffding tree
|
54.20
|
54.20
|
56.78
|
|
J48 tree
|
64.38
|
67.69
|
70.58
|
|
Random tree
|
51.14
|
59.07
|
66.91
|
|
K*
|
55.97
|
61.28
|
57.78
|
|
Decision table
|
65.70
|
66.81
|
66.17
|
|
AdaBoost (decision stump)
|
55.53
|
55.53
|
55.53
|
|
AdaBoost (random forest)
|
67.92
|
74.11
|
77.21
|
|
AdaBoost (random tree)
|
54.42
|
64.15
|
59.95
|
|
AdaBoost (SVM)
|
67.37
|
69.91
|
69.24
|
|
Bagging (REP tree)
|
72.12
|
73.00
|
74.33
|
|
Bagging (random tree)
|
64.60
|
72.34
|
73.89
|
|
Bagging (random forest)
|
64.60
|
72.34
|
75.88
|
|
Bagging (Naïve Bayes)
|
64.60
|
69.69
|
71.01
|
|
Bagging (SVM)
|
71.90
|
70.57
|
68.36
|
|
Logit
Boost (decision stump)
|
74.55
|
75.66
|
80.97
|
|
Logit Boost (random tree)
|
68.80
|
73.00
|
73.37
|
|
Stacking (ZeroR)
|
54.20
|
54.20
|
54.20
|
|
Stacking (random forest)
|
54.20
|
54.20
|
54.20
|
|
Stacking (random tree)
|
54.20
|
54.20
|
54.20
|
|
Stacking (decision stump)
|
54.20
|
54.20
|
54.20
|
|
Stacking (SVM)
|
54.20
|
54.20
|
54.20
|
Abbreviations: KNN,
k-Nearest Neighbors; SVM, Support Vector Machine; Lib, Library; REP, Reduced
Error Pruning; ZeroR, Zero Rule.
Across the five classifiers and three feature-selection
scenarios, consistent performance gains were observed as the feature set was
reduced from the full 279 variables to the Elite 27 features. Feature selection
substantially improved classifier performance, as reflected in the comparative
results across the three stages. Models trained without feature selection
showed only moderate accuracy due to noise and redundancy in the full dataset,
while restricting training to the top 50 features yielded noticeable
improvements by removing irrelevant attributes. The refined set of 27 elite
features further enhanced accuracy, particularly for random forest, Bayes net,
and LogitBoost.
As shown in Fig 1, the highest accuracy in the without feature
selection scenario was achieved by Bayes net at 69.91 percent, whereas in the best
features scenario the strongest performance was observed for both Bayes net and
LogitBoost at 75.66%. In the elite features scenario, LogitBoost with decision stump
achieved the highest overall performance at 80.97 percent, alongside a
precision of 88.52 percent, recall of 81.29 percent, and an AUC of 0.8084. As
shown in Table 6, All models showed parallel improvements in sensitivity and
specificity under the elite 27 configuration, and ensemble methods such as
AdaBoost and bagging also benefited substantially from feature reduction. These
findings demonstrate that the proposed multi-stage CFS framework yields a
compact and discriminative subset of ECG attributes that consistently
strengthens classification performance across modeling approaches.
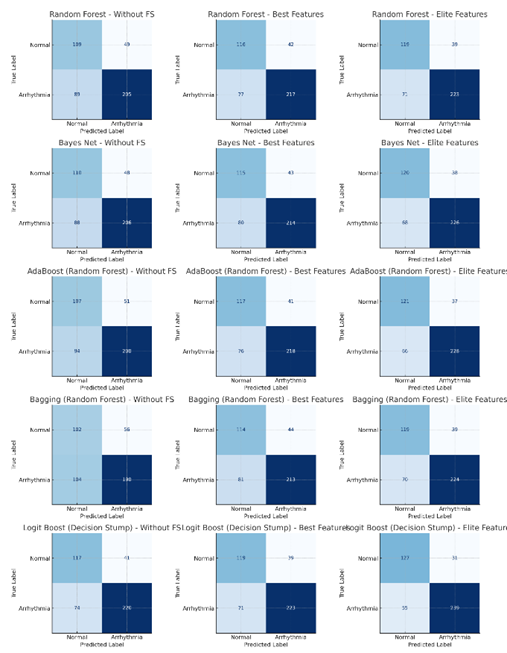
Fig 1: The confusion matrices of the best
classifiers
Table 6: Performance of five best models across
three feature-selection scenarios
|
Model
|
Feature Set
|
Accuracy
(%)
|
Precision
(%)
|
Recall
Sensitivity (%)
|
Specificity (%)
|
F1-Score (%)
|
ROC-AUC
|
TN
|
FP
|
FN
|
TP
|
|
Random forest
|
Without FS
|
69.47
|
80.71
|
69.73
|
68.99
|
74.82
|
0.6936
|
109
|
49
|
89
|
205
|
|
Random forest
|
Best Features
|
73.67
|
83.78
|
73.81
|
73.42
|
78.48
|
0.7361
|
116
|
42
|
77
|
217
|
|
Random forest
|
Elite Features
|
75.66
|
85.11
|
75.85
|
75.32
|
80.22
|
0.7558
|
119
|
39
|
71
|
223
|
|
Bayes net
|
Without FS
|
69.91
|
81.10
|
70.07
|
69.62
|
75.18
|
0.6984
|
110
|
48
|
88
|
206
|
|
Bayes net
|
Best Features
|
72.79
|
83.27
|
72.79
|
72.78
|
77.68
|
0.7279
|
115
|
43
|
80
|
214
|
|
Bayes net
|
Elite Features
|
76.55
|
85.61
|
76.87
|
75.95
|
81.00
|
0.7641
|
120
|
38
|
68
|
226
|
|
AdaBoost (random forest)
|
Without FS
|
67.92
|
79.68
|
68.03
|
67.72
|
73.39
|
0.6787
|
107
|
51
|
94
|
200
|
|
AdaBoost (random forest)
|
Best Features
|
74.12
|
84.17
|
74.15
|
74.05
|
78.84
|
0.7410
|
117
|
41
|
76
|
218
|
|
AdaBoost (random forest)
|
Elite Features
|
77.21
|
86.04
|
77.55
|
76.58
|
81.57
|
0.7707
|
121
|
37
|
66
|
228
|
|
Bagging (random forest)
|
Without FS
|
64.60
|
77.24
|
64.63
|
64.56
|
70.37
|
0.6459
|
102
|
56
|
104
|
190
|
|
Bagging (random forest)
|
Best Features
|
72.35
|
82.88
|
72.45
|
72.15
|
77.31
|
0.7230
|
114
|
44
|
81
|
213
|
|
Bagging (random forest)
|
Elite Features
|
75.88
|
85.17
|
76.19
|
75.32
|
80.43
|
0.7575
|
119
|
39
|
70
|
224
|
|
LogitBoost (decision stump)
|
Without FS
|
74.56
|
84.29
|
74.83
|
74.05
|
79.28
|
0.7444
|
117
|
41
|
74
|
220
|
|
LogitBoost (decision stump)
|
Best Features
|
75.66
|
85.11
|
75.85
|
75.32
|
80.22
|
0.7558
|
119
|
39
|
71
|
223
|
|
LogitBoost (decision stump)
|
Elite Features
|
80.97
|
88.52
|
81.29
|
80.38
|
84.75
|
0.8084
|
127
|
31
|
55
|
239
|
Given the class imbalance in our dataset, accuracy alone
may be misleading. Therefore, we emphasize complementary metrics such as
F1-score, ROC-AUC, and PR-AUC, which provide a more robust assessment of model
performance in imbalanced classification scenarios.
Fig 2 presents the distribution of the most influential
feature categories for the LogitBoost (decision stump) classifier. The
visualization identifies global cardiac parameters and V-lead complex measures
as the predominant categories, highlighting which ECG-derived characteristics
were most critical to the model's decision-making process.
Fig 3 presents a comparative heatmap of feature
importance scores across multiple machine learning models. It allows for a
direct visual assessment of which features are consistently ranked as important
by random forest, Bayes net, AdaBoost (random forest), bagging (random forest),
and LogitBoost (decision stump) algorithms, and which are unique to specific
model architectures.
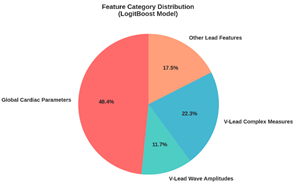
Fig 2: The LogitBoost model (decision stump) feature
category distribution
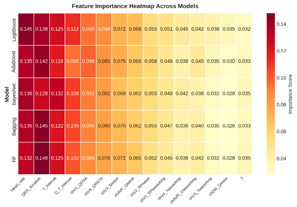
Fig 3: The feature importance heatmap across models
Fig 4 details the ranked importance of elite features
across the four top-performing classifiers. The analysis reveals that core
cardiac interval measures, heart rate, QRS duration, T interval, and Q-T
interval, emerged as the most influential and consistent predictors across all
algorithms. This cross-model consensus highlights these features as
particularly robust, stable drivers of high predictive accuracy irrespective of
the underlying model architecture.
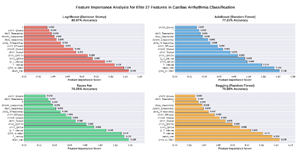
Fig 4: The feature importance analysis for elite
features across four models
Discussion
Feature selection is a critical step in machine learning
for reducing data dimensionality while retaining the most informative
attributes. In this study, a multi-step feature selection approach was employed
to progressively refine the dataset, ultimately identifying a compact set of
elite features that capture both global and localized cardiac phenomena. These
features provide a comprehensive representation of the cardiac electrical
activity, ensuring robust arrhythmia classification.
In the “Best Mode,” the feature selection process
identified the most relevant attributes, including QRS duration, T interval,
heart rate, and specific wave amplitudes such as chV3_TwaveAmp. Many of these
features were derived from multiple ECG leads (e.g., chDIII_Qwave, chAVF_Qwave,
chV3_Swave), enabling the model to capture diverse aspects of cardiac activity.
The frequency of feature selection across folds highlighted their stability and
predictive relevance. In the “Elite Mode,” the dataset was further refined to
27 critical features, emphasizing their consistent contribution to accurate
arrhythmia classification [15,
19].
Doran et al. explored the risk factors for CVD in their
research. Key factors identified in their study included elevated blood sugar
levels, high cholesterol, a BMI of 25 or higher, hypertension, smoking or
exposure to secondhand smoke, insufficient physical activity (PA), excessive
use of medications and alcohol, and poor adherence to healthy dietary
guidelines [20].
Previous studies have demonstrated the effectiveness of
machine learning in predicting cardiovascular outcomes across diverse
populations and datasets. Motwani et al. used LogitBoost on approximately
10,000 coronary CT angiography cases, achieving an AUC of 0.79 and
outperforming the Framingham risk score [21]. You et al. analyzed a prospective cohort of over
10,000 participants using demographic, lifestyle, and medication data,
achieving 87% accuracy with an ensemble ML approach for 10-year risk prediction
[22]. Kang et al. applied
LASSO regression on 280 myocardial infarction patients, selecting 5 key
variables from 46 clinical predictors, achieving a c-statistic of 0.809 [23]. Ma et al. predicted
coronary CVDS risk in 1,500 diabetic patients using XGBoost, random forest, and
logistic regression, with an AUC of 0.701 [24]. To explore patterns associated with the type and
prognosis of amyloidosis, Allegra et al. categorized data from 1,394 patients
into four groups: AL, ATTRv, ATTRwt, and cases without a definitive amyloidosis
diagnosis. These classifications were carried out 24 times across various
categories, including demographic factors (such as gender, race, and age),
biometric data (like body mass index), cardiovascular risk factors, and more.
Subsequently, the data were grouped into seven clusters using unsupervised
clustering techniques. The study then compared patient prognosis, survival
rates, and other outcomes across these clusters, particularly for those with
confirmed amyloid subtypes [25].
Although these studies differ substantially in population
size, data modality, and prediction task, they collectively highlight the
importance of robust feature selection and ensemble learning in cardiovascular
risk modeling.
Compared to these studies, the present work analyzed 452
patients from the UCI Arrhythmia dataset with 279 ECG-based features across 12
leads. Over 30 machine learning models, including boosting and bagging
algorithms, were evaluated. By implementing a three-phase feature selection
pipeline and focusing on elite feature consistency, this study achieved an
accuracy of 80.97%, demonstrating the importance of rigorous feature selection
in improving arrhythmia classification. Selected features such as QRS duration,
T interval, heart rate, and lead-specific wave amplitudes consistently
contributed to model performance, highlighting both physiological relevance and
predictive power.
QRS duration and T interval are well-known ECG parameters
critical for arrhythmia diagnosis and monitoring, while features such as
chAVR_JJwaveAmp, Q-T interval, and chV6_QRSTA showed strong, though slightly
less universal, relevance. Other attributes, including chAVF_QwaveAmp,
chV4_TwaveAmp, and chV6_TwaveAmp, emphasize the importance of amplitude and
waveform characteristics in capturing subtle arrhythmogenic patterns. Overall,
the selected features reflect both global and local cardiac phenomena, ensuring
comprehensive modeling of the heart’s electrical activity.
These findings highlight that careful feature selection
not only improves model accuracy but also enhances interpretability by focusing
on physiologically meaningful ECG attributes. The study underscores the
potential of multi-stage feature selection frameworks to produce compact,
discriminative feature sets that consistently improve machine learning
performance across diverse modeling approaches.
Limitations and future directions
One of the primary limitations of this study is the
relatively small sample size (452 patients) and the limited number of data
points (279 features), which may reduce the generalizability of the findings to
the broader population of individuals with cardiac arrhythmias. To enhance
future research, it is recommended to utilize larger and more diverse datasets
to increase the applicability and robustness of the models. Our binary classification
approach, while sacrificing arrhythmia-specific differentiation, offers
practical clinical utility for initial screening. In resource-constrained
environments or for preliminary automated analysis, identifying any abnormality
with high sensitivity (81.29% with elite features) can prioritize cases for
expert review. The selected features are broadly indicative of electrical
disturbances across multiple arrhythmia types, making them suitable for this
first-line detection task. Future work should extend our feature selection
framework to hierarchical or multi-class settings to address specific
arrhythmia identification while building upon the robust feature subset
identified here
Another limitation lies in the narrow scope of features,
with a primary focus on ECG data. This constraint may affect the model’s
predictive accuracy. Future studies should expand the feature space by
incorporating broader clinical parameters such as patient history, medication
use, and comorbidities, as well as contextual factors like social determinants
of health, environmental exposures, and lifestyle habits (diet, exercise,
smoking). These elements can have a meaningful influence on cardiovascular
health and may contribute to more nuanced and accurate predictive models.
Although multiple metrics were reported, model selection
was primarily guided by accuracy. Future research should explore a variety of
algorithms, evaluation techniques, and performance metrics to obtain a more
nuanced understanding of model effectiveness. Moreover, for better validation
and generalizability, it is advisable to test the models using independent
datasets from external data centers that were not involved in the initial model
development. This approach can lead to the creation of more reliable and widely
applicable predictive models.
Conclusion
This study underscores the vital role of feature
selection in enhancing ML-based classification of arrhythmias. This research
demonstrates a novel stepwise feature selection approach that improves
classifier performance while enhancing feature interpretability. The use of
cross-fold feature frequency and the clear delineation of "best" and
"elite" feature sets provide clinicians and data scientists with
deeper insight into the most consistent and diagnostically valuable ECG
parameters. Our findings suggest that such a refined and reproducible process
can lead to more robust clinical decision support tools, setting a
methodological precedent for future work in cardiac arrhythmia classification.
By carefully refining the feature set, the study achieved notable improvements
in accuracy, computational efficiency, and interpretability. Future efforts
should aim to validate these methods using larger and more heterogeneous
datasets, incorporate domain-specific knowledge to improve generalizability,
and develop practical, clinician-friendly diagnostic tools. Effective feature
selection not only boosts the technical performance of ML models but also
strengthens the connection between data-driven approaches and real-world medical
practice.
Acknowledgement
The authors gratefully acknowledge the valuable support
and collaboration of the experts who contributed to this research.
Author’s contribution
SAFA: Conceptualization, methodology, data analysis, supervision,
writing original draft, review & editing; AA: Conceptualization, methodology,
project administration, writing original draft, review & editing.
All authors contributed to the literature review, design,
data collection, drafting the manuscript, read and approved the final
manuscript.
Conflicts of interest
The authors declare no conflicts of interest regarding
the publication of this study.
Ethical Approval
This study utilized de-identified, publicly available
data from the UCI Machine Learning Repository. All datasets within this
repository have been anonymized to protect participant privacy by removing any
personal identifiers prior to public release. As the research involved the
analysis of this pre-existing, anonymized data, it was exempt from requiring
separate ethical approval from an institutional review board. The study was
conducted in accordance with recognized standards for the secondary analysis of
public data.
Financial disclosure
No financial interests related to the material of this
manuscript have been declared.
References
1.
Ha ACT, Doumouras BS, Wang CN, Tranmer J, Lee DS.
Prediction of sudden cardiac arrest in the general population: Review of traditional
and emerging risk factors. Can J Cardiol. 2022; 38(4): 465-78. PMID: 35041932 DOI: 10.1016/j.cjca.2022.01.007 [PubMed]
2.
Ozcan M, Peker S. A classification and regression
tree algorithm for heart disease modeling and prediction. Healthcare Analytics.
2023; 3: 100130.
3.
Zhong L, Xie B, Wang H-L, Ji X-W. Causal
association between remnant cholesterol level and risk of cardiovascular
diseases: A bidirectional two sample mendelian randomization study. Sci Rep.
2024; 14(1): 27038. PMID: 39511362 DOI: 10.1038/s41598-024-78610-0
[PubMed]
4.
Lallah PN, Laite C, Bangash AB, Chooah O, Jiang C.
The use of artificial intelligence for detecting and predicting atrial arrhythmias
post catheter ablation. Rev Cardiovasc Med. 2023; 24(8): 215. PMID: 39076714 DOI: 10.31083/j.rcm2408215 [PubMed]
5.
Truong ET, Lyu Y, Ihdayhid AR, Lan NS, Dwivedi G.
Beyond clinical factors: Harnessing artificial intelligence and multimodal cardiac
imaging to predict atrial fibrillation recurrence post-catheter ablation. J
Cardiovasc Dev Dis. 2024; 11(9): 291. PMID: 39330349 DOI: 10.3390/jcdd11090291
[PubMed]
6.
Roth GA, Mensah GA, Johnson CO, Addolorato G,
Ammirati E, Baddour LM, et al. Global burden of cardiovascular diseases and
risk factors, 1990–2019: Update from the GBD 2019 study. J Am Coll Cardiol.
2020; 76(25): 2982-3021. PMID: 33309175 DOI: 10.1016/j.jacc.2020.11.010
[PubMed]
7.
Mehta LS, Warnes CA, Bradley E, Burton T, Economy
K, Mehran R, et al. Cardiovascular considerations in caring for pregnant
patients: A scientific statement from the American heart association.
Circulation. 2020; 141(23): e884-903. PMID: 32362133 DOI: 10.1161/CIR.0000000000000772
[PubMed]
8.
Mela A, Rdzanek E, Poniatowski LA, Jaroszynski J,
Furtak-Niczyporuk M, Galazka-Sobotka M, et al. Economic costs of cardiovascular
diseases in Poland estimates for 2015–2017 years. Front Pharmacol. 2020; 11: 1231.
PMID: 33013357 DOI: 10.3389/fphar.2020.01231 [PubMed]
9.
Li X, Cai W, Xu B, Jiang Y, Qi M, Wang M.
SEResUTer: A deep learning approach for accurate ECG signal delineation and
atrial fibrillation detection. Physiol Meas. 2023; 44(12): 125005. PMID: 37827168 DOI: 10.1088/1361-6579/ad02da [PubMed]
10.
Abasi A, Nazari A, Moezy A, Fatemi Aghda SA.
Machine learning models for reinjury risk prediction using cardiopulmonary
exercise testing (CPET) data: Optimizing athlete recovery. BioData Mining.
2025; 18(1): 16. PMID: 39962522 DOI: 10.1186/s13040-025-00431-2
[PubMed]
11.
Quartieri F, Marina-Breysse M, Toribio-Fernandez R,
Lizcano C, Pollastrelli A, Paini I, et al. Artificial intelligence cloud
platform improves arrhythmia detection from insertable cardiac monitors to 25
cardiac rhythm patterns through multi-label classification. J Electrocardiol.
2023; 81: 4-12. PMID: 37473496 DOI: 10.1016/j.jelectrocard.2023.07.001
[PubMed]
12.
Zhang Y, Liu S, He Z, Zhang Y, Wang C. A CNN model
for cardiac arrhythmias classification based on individual ECG signals.
Cardiovasc Eng Technol. 2022; 13(4): 548-57. PMID: 34981316 DOI: 10.1007/s13239-021-00599-8
[PubMed]
13.
Garcha I, Phillips SP. Social bias in artificial
intelligence algorithms designed to improve cardiovascular risk assessment
relative to the Framingham Risk Score: A protocol for a systematic review. BMJ
Open. 2023; 13(5): e067638. PMID: 37258078 DOI: 10.1136/bmjopen-2022-067638
[PubMed]
14.
Shi J, Li Z, Liu W, Zhang H, Guo Q, Chang S, et al.
Optimized solutions of electrocardiogram lead and segment selection for
cardiovascular disease diagnostics. Bioengineering (Basel). 2023; 10(5): 607. PMID: 37237677 DOI: 10.3390/bioengineering10050607 [PubMed]
15.
Jekova I, Christov I, Krasteva V. Atrioventricular
synchronization for detection of atrial fibrillation and flutter in one to
twelve ECG leads using a dense neural network classifier. Sensors (Basel).
2022; 22(16): 6071. PMID: 36015834 DOI: 10.3390/s22166071
[PubMed]
16.
Guvenir H, Acer B, Muderrisoglu H, Quinlan R. UCI machine
learning repository: Arrhythmia [dataset]. 1997 [cited: 15 Sep 2025].
Available from: https://archive.ics.uci.edu/dataset/5/arrhythmia
17.
Irfan S, Anjum N, Althobaiti T, Alotaibi AA,
Siddiqui AB, Ramzan N. Heartbeat classification and arrhythmia detection using
a multi-model deep-learning technique. Sensors (Basel). 2022; 22(15): 5606. PMID: 35957162 DOI: 10.3390/s22155606 [PubMed]
18.
Xiao Q, Lee K, Mokhtar SA, Ismail I, Pauzi AL,
Zhang Q, et al. Deep learning-based ECG arrhythmia classification: A systematic
review. Applied Sciences (Basel). 2023; 13(8): 4964.
19.
Zhang H, Wang X, Liu C, Liu Y, Li P, Yao L, et al.
Detection of coronary artery disease using multi-modal feature fusion and
hybrid feature selection. Physiol Meas. 2020; 41(11): 115007. PMID: 33080588 DOI: 10.1088/1361-6579/abc323 [PubMed]
20.
Doran K, Resnick B. Cardiovascular risk factors of
long-term care workers. Workplace Health Saf. 2017; 65(10): 467-77. PMID: 28422575 DOI: 10.1177/2165079917693018 [PubMed]
21.
Motwani M, Dey D, Berman DS, Germano G, Achenbach
S, Al-Mallah MH, et al. Machine learning for prediction of all-cause mortality
in patients with suspected coronary artery disease: A 5-year multicentre
prospective registry analysis. Eur Heart J. 2017; 38(7): 500-7. PMID: 27252451 DOI: 10.1093/eurheartj/ehw188 [PubMed]
22.
You J, Guo Y, Kang J-J, Wang H-F, Yang M, Feng J-F,
et al. Development of machine learning-based models to predict 10-year risk of
cardiovascular disease: A prospective cohort study. Stroke Vasc Neurol. 2023; 8(6):
475-85. PMID: 37105576 DOI: 10.1136/svn-2023-002332
[PubMed]
23.
Kang MG, Koo B-K, Tantry US, Kim K, Ahn J-H, Park
HW, et al. Association between thrombogenicity indices and coronary
microvascular dysfunction in patients with acute myocardial infarction. JACC
Basic Transl Sci. 2021; 6(9): 749-61. PMID: 34754989 DOI: 10.1016/j.jacbts.2021.08.007
[PubMed]
24.
Ma C-Y, Luo Y-M, Zhang T-Y, Hao Y-D, Xie X-Q, Liu
X-W, et al. Predicting coronary heart disease in Chinese diabetics using
machine learning. Comput Biol Med. 2024; 169: 107952. PMID:
38194779 DOI: 10.1016/j.compbiomed.2024.107952
[PubMed]
25.
Allegra A, Mirabile G, Tonacci A, Genovese S,
Pioggia G, Gangemi S. Machine learning approaches in diagnosis, prognosis and
treatment selection of cardiac amyloidosis. Int J Mol Sci. 2023; 24(6): 5680. PMID: 36982754 DOI: 10.3390/ijms24065680 [PubMed]