Comparing machine learning
algorithms for prediction of osteoporosis: A systematic review and
meta-analysis study
Esmat Mashoof1 , Khadijeh Moulaei2, Naser Nasiri3*
1Department of Health
Information Technology, Varastegan Institute for Medical Sciences, Mashhad,
Iran
2Health Management
and Economics Research Center, Health Management Research Institute, Iran
University of Medical Sciences, Tehran, Iran
3School of Public
Health, Jiroft University of Medical Sciences, Jiroft, Kerman, Iran
|
Article Info
|
A B S T R A C T
|
|
Article type:
Review
|
Introduction:
Osteoporosis is a prevalent bone disease that affects millions of individuals
worldwide. Early identification and prediction of osteoporosis can enable
timely interventions and preventive measures. This study investigates the
potential of machine learning algorithms to accurately predict osteoporosis.
Material
and Methods: This study is a systematic review and meta-analysis
conducted by searching in three databases. Our search encompassed databases
such as Web of Science, PubMed, and Scopus. Pertinent information from the
selected studies was independently extracted by two authors. The PRISMA
guidelines were followed to ensure a rigorous review process. The PROBAST tool
was utilized to assess the risk of bias in the included studies. Data
analysis was performed using Stata (v.17.1).
Results:
A total of 63 algorithms from 18 studies were evaluated. In terms of
predicting osteoporosis, support vector machine (SVM) and random forest (RF)
algorithms demonstrated the highest sensitivity. For SVM, the sensitivity and
diagnostic odds ratio (DOR) were 83.0% (95% confidence interval (CI):
76.0-88.0) and 10.4 (95% CI: 6.0-18.2), respectively. Similarly, in the case
of RF algorithm, the sensitivity and DOR were 81.0% (95% CI: 74.0-87.0) and
13.0 (95% CI: 7.7-21.2), respectively. The artificial neoural networks (ANN),
RF, and K-nearest neighbors (KNN) algorithms exhibited the highest
specificity values: ANN- specificity of 79.0% (95% CI: 71.0-85.0) and DOR of
12.0 (7.3-18.7); RF- specificity of 75.0% (95% CI: 62.0-84.0) and DOR of 13.0
(7.7-21.2); KNN- specificity of 75.0% (95% CI: 67.0-82.0) and DOR of
7.7(6.6-9.0).
Conclusion:
Our study highlights the promising potential of machine learning algorithms
for the accurate prediction of osteoporosis. ANN model and SVM, RF, and KNN
algorithms have emerged as the most robust predictors. These findings
demonstrate substantial potential for aiding early detection and intervention
strategies against osteoporosis.
|
|
Article
History:
Received: 2026-01-10
Accepted: 2026-02-08
Published: 2026-02-10
|
|
* Corresponding
author:
Naser Nasiri
School of Public Health, Jiroft University of
Medical Sciences, Jiroft, Kerman, Iran
Email: nasiri.epi@gmail.com
|
|
Keywords:
Osteoporosis
Prediction
Machine Learning
Algorithm
|
|
Cite this paper as:
Mashoof S, Moulaei K, Nasiri
N. Comparing machine learning algorithms for
prediction of osteoporosis: A systematic review and meta-analysis study. Adv Med Inform. 2026; 2: 9.
|
Introduction
Osteoporosis, a common skeletal disorder, poses
significant challenges for individuals affected by it. This condition is
characterized by reduced bone density and deterioration of bone
microarchitecture, resulting in increased vulnerability to fractures [1]. Osteoporosis predominantly affects older adults,
particularly postmenopausal women [2], but can also occur
in men and younger individuals [3]. One of the primary
challenges of osteoporosis lies in its asymptomatic nature until a fracture
occurs, leading to delayed diagnosis and treatment initiation [4].
Moreover, the progressive nature of the disease increases the risk of recurrent
fractures and significant impairment in mobility and quality of life [5].
Osteoporosis presents numerous challenges for individuals
affected by the condition. One of the primary problems is the increased risk of
fractures, which can lead to pain, disability, and a significant decline in
quality of life [5, 6]. Osteoporotic
fractures, especially in the hip and spine, can result in prolonged
hospitalization, surgical interventions, and long-term rehabilitation [7]. Another issue is the asymptomatic nature of osteoporosis
until a fracture occurs, making it difficult to detect and intervene at an
early stage [8]. Additionally, the progressive nature of
the disease puts individuals at a higher risk of recurrent fractures [9], further exacerbating the physical and emotional burden [10]. Addressing these problems requires early detection and
prediction of osteoporosis.
The early detection and prediction of osteoporosis play a
crucial role in preventing debilitating fractures and implementing appropriate
interventions [11]. Traditional approaches for
osteoporosis prediction rely on risk assessment tools based on clinical factors
and dual-energy X-ray absorptiometry (DXA) scans. However, emerging research
suggests that machine learning techniques have the potential to improve the
accuracy and efficiency of osteoporosis prediction by integrating diverse data
sources [12]. These techniques can integrate various types
of data, such as clinical, genetic, and imaging information, to improve the
accuracy and efficiency of predicting osteoporosis risk.
Machine learning models have the potential to identify
high-risk individuals earlier, enabling timely interventions and preventive
measures to mitigate the progression of osteoporosis and reduce fracture risk [13, 14]. In this context, we present a
systematic review and meta-analysis study aimed at evaluating the predictive
capabilities of machine learning models in identifying individuals at risk of
osteoporosis. Through synthesizing and analyzing existing literature, we aim to
provide a comprehensive overview of the current state of research in this field
and shed light on the potential clinical implications of machine learning-based
osteoporosis prediction.
Material and Methods
In this study, we utilized the Preferred Reporting
Information for systematic reviews and meta-analysis (PRISMA) checklist to
select studies and report the results.
Data Sources and Search strategy
To conduct this study, we conducted searches in Web of
Science, PubMed, and Scopus databases to identify relevant published papers
until July 10, 2023. To retrieve the relevant study, we employed the following
search strategy:
((“Machine learning” OR “artificial intelligence” OR
“machine learning algorithms” OR “deep learning” OR “neural networks” OR
“artificial neural network”) AND (“low bone density” OR “osteoporosis” OR
“osteopenia”))
Eligibility criteria
This study included articles that specifically addressed
the prediction of osteoporosis using machine learning techniques. The inclusion
criteria considered articles published in English, centering on the use of
machine learning for osteoporosis prediction, and reporting machine learning
algorithms, sensitivity, specificity, and/or receiver operating characteristic
curve (ROC). Exclusion criteria were applied to papers that did not primarily
concentrate on the prediction of osteoporosis with machine learning.
Additionally, letters to the editor, conference abstracts, book chapters, and books,
were excluded from the study.
Study selection
Initially, abstracts of relevant articles were collected
from three databases: Web of Science, PubMed, and Scopus. These study abstracts
were then imported into EndNote 21. Afterward, any duplicate articles were
removed. Two researchers reviewed the titles and abstracts to select the
relevant articles based on the inclusion and exclusion criteria.
In instances of disagreement, the research team members
resolved disagreements through discussions, arriving at the ultimate decision
for each article. Ultimately, the full text of the articles was examined to extract
essential data.
Data charting process and data items
For each study, the following information was extracted:
authors name, year of publication, study aim, used database, machine learning
algorithms used, sample size, as well as measures used for assessing algorithm
performance such as specificity, sensitivity, accuracy, positive predictive
value (PPV), negative predictive value (NPV), and receiver operating
characteristic (ROC) curve. For case studies lacking details on positive and
negative cases, we conducted manual calculations using recognized formulas based
on statistics available in the manuscripts or provided by the authors. When required
data were not presented in the manuscripts or abstracts, we contacted the
authors for clarification. Our initial contact prioritized the corresponding
author, followed by the first author, and then the last author. If attempts to
contact the authors in this specified sequence were unsuccessful, the studies
were excluded from the meta-analysis. Furthermore, manuscripts or abstracts
without sufficient evaluation data after author contact were also excluded.
Critical appraisal of individual sources of studies
To critically appraise individual sources of studies, we
utilized the prediction model risk of bias assessment tool (PROBAST). This tool
facilitates the assessment of both the risk of bias (ROB) and the applicability
of diagnostic and prognostic prediction model studies. The PROBAST tool
consists of 20 signaling questions that are categorized into four domains: participants,
predictors, outcome, and analysis. This accompanying document provides a
comprehensive explanation and elaboration for each domain and signaling
question's inclusion. It serves as a helpful resource for researchers,
reviewers, readers, and guideline developers, aiding them in effectively
employing the tool to evaluate both the risk of bias and applicability concerns
within their assessments [15].
Statistical analysis
In this study, a meta-analysis was conducted using a 2x2
contingency table. The table was constructed to include values for true false
positive (FP), positive (TP), false negative (FN), and true negative (TN).
Meta-analysis for diagnostic tests was carried out when more than four studies
reported algorithms for predicting osteoporosis. The models encompassed
estimates of sensitivity, specificity, diagnostic odds ratio, positive
likelihood, negative likelihood, and ROC. The 'metandi' and 'metadta' commands
in Stata (versions 17.1 and 14.1) were used to model these values along with
95% confidence intervals (CIs).
Results
After extracting 1564 papers from three databases,
duplicate entries were excluded, resulting in a collection of 1196 unique
studies. Subsequently, these studies underwent a meticulous review and
evaluation based on pre-established criteria for inclusion and exclusion. After
this comprehensive assessment, a final set of 17 articles was selected for
inclusion in the research (Fig 1).
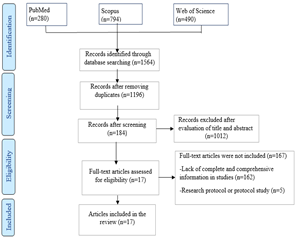
Fig 1: PRISMA diagram depicting the screening
and inclusion process of studies
Characteristics of the included studies
Table 1 provides a thorough summary of the selected
studies. A total of 63 algorithms from 17 distinct studies were evaluated. The
majority of the studies were conducted in China (n=6) and Korea (n=5).
Table 1: Comprehensive examination of the
chosen studies
|
Ref
|
Year
|
Country
|
Database name
|
Number of samples
|
Number of algorithms
|
Algorithm name
|
|
[16]
|
2009
|
Korea
|
Korea National Health and
Nutrition Examination Surveys (KNHANES)
|
1792
|
7
|
KNN, random forest (RF), gradient
boosting machine (GBM), SVM, ANN, decision tree (DT), and logistic regression
(LR)
|
|
[17]
|
2010
|
Chaina
|
Medical records of participants
at the Second Affiliated Hospital of Harbin Medical University and the
Affiliated Hospital of the Medical School of Ningbo University.
|
1559
|
1
|
ANN
|
|
[18]
|
2013
|
Taiwan
|
The dataset in this study, which
included SNPs, age, menopause, and BMI, was the same dataset used in a
previous study by the first author of this paper [9]
|
295
|
3
|
Multilayer feedforward neural
network (MFNN), Naive Bayes (NB), and LR
|
|
[19]
|
2013
|
Korea
|
Korea National Health and
Nutrition Examination Surveys (KNHANES)
|
1674
|
4
|
SVM, RF, ANN, and LR
|
|
[20]
|
2013
|
Korea
|
Korea National Health and
Nutrition Examination Surveys (KNHANES V-1)
|
1674
|
4
|
SVM, RF, ANN, and LR
|
|
[21]
|
2016
|
China
|
Data collated from chain
hospitals
|
119
|
2
|
ANN, LR
|
|
[22]
|
2019
|
Chaina
|
Data were collated from the
electronic medical record systems of the Second Affiliated Hospital of Harbin
Medical University and the Affiliated Hospital of the Medical School of
Ningbo University.
|
1559
|
1
|
ANN
|
|
[14]
|
2020
|
Korea
|
Korea National Health and
Nutrition Examination Surveys (KNHANES)
|
1792
|
7
|
LR, KNN, DT, RF, GBM, SVM, ANN
|
|
[23]
|
2021
|
Taiwan
|
Data were collected from
individuals living in the community who took part in health checkup programs
at a medical center in northern Taiwan from 2008 to 2018.
|
5982
|
5
|
ANN, SVM, RF, KNN, LR
|
|
[24]
|
2021
|
China
|
Data collection from Hospital of
Chongqing Medical University
|
1419
|
4
|
Deep Belief Network (DBN), SVM
ANN, and combinatorial heuristic method (Genetic Algorithm - Decision Tree
(GA-DT))
|
|
[25]
|
2021
|
Korea
|
Data collated from Hallym
University Sacred hospital
|
500
|
1
|
RF
|
|
[26]
|
2021
|
Greece
|
Data was collated from cases
referred to a university hospital's specialized bone marrow imaging referral
clinic.
|
213
|
3
|
Extreme gradient boosting
(XGBoost), CatBoost and SVM
|
|
[27]
|
2022
|
India
|
Data collated from Abhilasha
orthopedic hospital in Banashankari
|
80
|
4
|
DT, NB, SVM, KNN
|
|
[28]
|
2022
|
China
|
Data collated from the Second
Affiliated Hospital of Wenzhou Medical University
|
172
|
5
|
Gaussian naïve Bayes (GNB), RF,
LR, SVM, Gradient boosting machine (GBM), and XGBoost
|
|
[29]
|
2023
|
USA
|
Data for this secondary analysis
was collected from patients participating in the Study of Women's Health
Across the Nation (SWAN), who initially joined between 1996 and 1997 at seven
designated research centers across the USA.
|
1,685
|
1
|
LR
|
|
[30]
|
2023
|
China
|
Data collated from department of
Endocrinology at Cangzhou Central Hospital
|
433
|
9
|
XGBoost, LR, Light Gradient
Boosting Machine (LightGBM), RF, Multilayer Perceptron (MLP), Gaussian Naive
Bayes (Gaussian NB), Adaptive Boosting (AdaBoost), SVM, and KNN
|
|
[31]
|
2023
|
USA
|
Data collected from a tertiary
care academic centre.
|
273
|
2
|
SVM, and RF
|
Machine learning algorithms and osteoporosis prediction
We present the results of six algorithms used for
predicting osteoporosis: ANN, was recommended in 10 studies, encompassing a
sample size of 17,570; LR was recommended in 11 studies, with a total sample
size of 15,618; SVMs were recommended in 12 studies, involving a sample size of
15,504; RF algorithms were recommended in 9 studies, with a sample size of
12,618; KNN algorithms were recommended in six studies, with a sample size of
10,079; and DT algorithms were recommended in four studies, with a sample size
of 5,083.
The results of this review reveal that SVM and RF
algorithms exhibited the highest sensitivity, whereas the ANN model, RF, and
KNN algorithms demonstrated the highest levels of specificity. Subsequently,
detailed findings for each algorithm are described below.
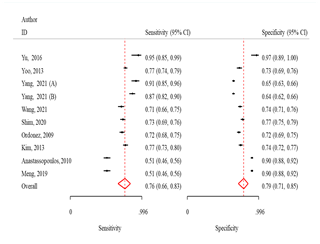
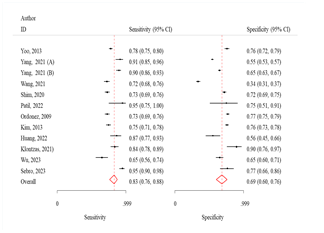
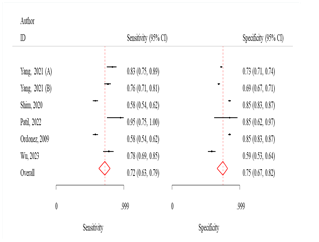
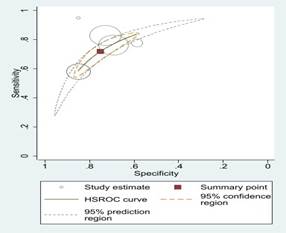
ANN
The sensitivity and specificity were 76.0% (95% CI:
66.0-83.0) and 79.0% (95% CI: 71.0-85.0), respectively (Fig 2). The odds of
obtaining positive results in the test outcomes for osteoporosis patients were
12.0 times higher (95% CI: 7.3-18.7) than in non-patients, and the likelihood
of a positive test result was 3.6 times higher (95% CI: 2.7-4.8) (Table 2)
LR algorithm
The sensitivity and specificity were 76.0 (95% CI:
65.0-84.0) and 70.0 (95% CI: 63.0-77.0) respectively (Fig 2). The odds of
obtaining positive results in the test outcomes for osteoporosis patients was
7.4 times (95% CI: 4.3-12.5) higher than in non-patients, also probable
positivity in the test results was 2.6 times (95% CI: 2.0-3.2) (Table 2).
SVM algorithm
The sensitivity and specificity were 83.0% (95% CI:
76.0-88.0) and 69.0% (95% CI: 60.0-76.0), respectively (Fig 2). The odds of
obtaining positive results in the test outcomes for osteoporosis patients were
10.4 times higher (95% CI: 6.0-18.2) than in non-patients, and the likelihood
of a positive test result was 2.6 times higher (95% CI: 2.0-3.4) (Table 2).
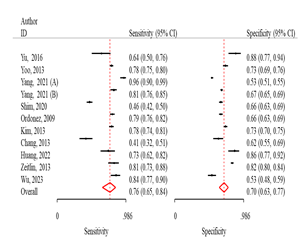
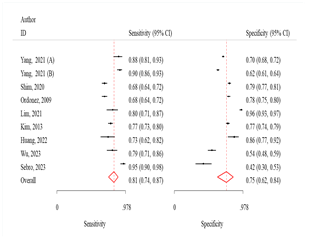
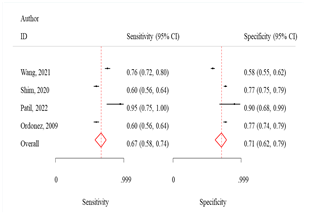
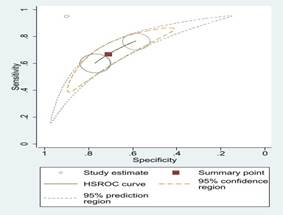
RF algorithm
The sensitivity and specificity were 81.0 (95% CI:
74.0-87.0) and 75.0 (95% CI: 62.0-84.0) respectively (Fig 3). The odds of
obtaining positive results in the test outcomes for osteoporosis patients was
13.0 times (95% CI: 7.7-21.2) higher than in non-patients, also probable
positivity in the test results was 3.2 times (95% CI: 2.1-4.8) (Table 2).
KNN algorithm
The sensitivity and specificity were 72.0% (95% CI:
63.0-70.0) and 75.0% (95% CI: 67.0-82.0), respectively (Fig 3). The odds of
obtaining positive results in the test outcomes for osteoporosis patients were
7.7 times higher (95% CI: 6.6-9.0) than in non-patients. Additionally, the
likelihood of a positive test result was 2.8 times higher (95% CI: 2.3-3.5)
(Table 2).
DT algorithm
The sensitivity and specificity were 67.0% (95% CI:
58.0-74.0) and 71.0% (95% CI: 62.0-79.0), respectively (Fig 3). The odds of
obtaining positive results in the test outcomes for osteoporosis patients were
5.0 times higher (95% CI: 4.3-5.6) than in non-patients. Additionally, the
likelihood of a positive test result was 2.3 times higher (95% CI: 2.0-2.7)
(Table 2).
Table 2: Algorithms
employed in the prediction of osteoporosis
|
Algorithms
|
Algorithm’s frequency in studies
|
Sensitivity (95%CI)
|
Specificity (95%CI)
|
DOR
|
Positive likelihood ratio
|
Negative likelihood ratio
|
I2
|
|
ANN
|
10
|
76.0
(66.0-83.0)
|
79.0
(71.0-85.0)
|
12.0
(7.3-18.7)
|
3.6 (2.7-4.8)
|
3.3 (2.4-4.5)
|
95.0
|
|
LR
|
11
|
76.0
(65.0-84.0)
|
70.0
(63.0-77.0)
|
7.4
(4.3-12.5)
|
2.6 (2.0-3.2)
|
2.9 (2.0-4.2)
|
93.3
|
|
SVM
|
12
|
83.0
(76.0-88.0)
|
69.0
(60.0-76.0)
|
10.4
(6.0-18.2)
|
2.6 (2.0-3.4)
|
4.0 (2.8-5.6)
|
87.5
|
|
RF
|
9
|
81.0
(74.0-87.0)
|
75.0
(62.0-84.0)
|
13.0
(7.7-21.2)
|
3.2 (2.1-4.8)
|
4.0 (2.9-5.4)
|
93.2
|
|
KNN
|
6
|
72.0
(63.0-70.0)
|
75.0
(67.0-82.0)
|
7.7
(6.6-9.0)
|
2.8 (2.3-3.5)
|
2.7 (2.2-3.3)
|
0.67
|
|
DT
|
4
|
67.0
(58.0-74.0)
|
71.0
(62.0-79.0)
|
5.0
(4.3-5.6)
|
2.3 (2.0-2.7)
|
2.1 (2.0-2.5)
|
0.2
|
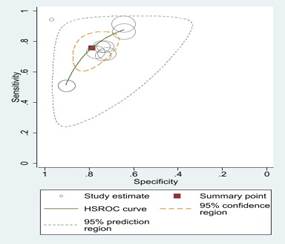
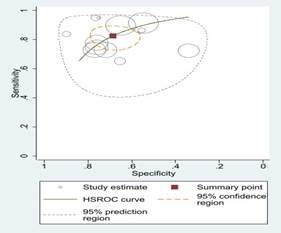
Fig 2: Sensitivity
and specificity and ROC curves comparing different machine learning algorithms
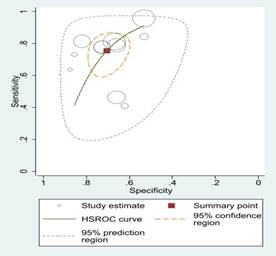
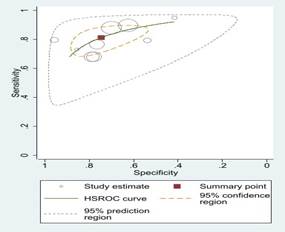
Fig 3: Comparison
of various machine learning algorithms using Sensitivity and Specificity along
with ROC curves.
Discussion
To our current understanding, this study is the inaugural
instance of a meta-analytic methodology employed in the field of machine
learning research, encompassing numerous studies with thousands of
participants, and centering on predicting machine learning algorithms'
performance in osteoporosis. This study stands out as a groundbreaking endeavor
in the realm of meta-analytic approaches applied to machine learning research. Thorough
examination encompasses numerous studies with thousands of participants, providing
insights into the effectiveness of different machine learning algorithms for
predicting osteoporosis. The findings from this review indicate that SVM and RF
algorithms exhibited the highest sensitivity. On the other hand, the ANN model,
RF, and KNN algorithms demonstrated the highest specificity values.
As it mentioned a significant finding of this study is
the elevated performance of the SVM and RF algorithms in terms of sensitivity.
Various studies [32, 33] have shown
that SVM and RF algorithms are very effective in predicting osteoporosis. This
observation resonates with previous research demonstrating the prowess of these
algorithms in capturing intricate patterns within datasets [34].
The capacity of SVM and RF algorithms to detect even subtle variations within
data suggests their suitability for identifying individuals at risk of
osteoporosis at an early stage [32]. This aspect of the
findings underscores the importance of these algorithms as potential tools in
clinical settings, enabling healthcare practitioners to intervene promptly and
implement preventive measures to mitigate the progression of osteoporosis.
The elevated sensitivity observed in these algorithms
could be attributed to their underlying mechanisms. SVM works by finding the
optimal hyperplane that maximally separates different classes in the dataset.
This capability enables SVM to accurately discriminate between healthy
individuals and those at risk of osteoporosis, even when the differences are
subtle [35]. On the other hand, RF employs an ensemble of
decision trees to make predictions [36]. By combining the
outputs of multiple trees, RF can capture complex interactions among variables
and make robust predictions, which proves beneficial in identifying early signs
of osteoporosis. As it mentioned a significant finding of this study is the elevated
performance of the SVM and RF algorithms in terms of sensitivity. This
observation resonates with previous research demonstrating the prowess of these
algorithms in capturing intricate patterns within datasets.
This aspect of the findings underscores the importance of
these algorithms as potential tools in clinical settings. The ability of SVM
and RF algorithms to identify individuals at risk with high sensitivity
suggests their potential application in real-world clinical settings. Javaid et
al. [37], mentioned that healthcare practitioners can
leverage these algorithms to accurately identify those who need closer
monitoring or preventive measures. This proactive approach could lead to
improved patient outcomes, reduced healthcare costs, and an overall enhancement
in the management of osteoporosis.
Conversely, the study also brings attention to the high
specificity values demonstrated by the ANN model, RF, and KNN algorithms. This
facet of the findings emphasizes the accuracy of these algorithms in correctly
identifying individuals without osteoporosis, further establishing their
utility in the clinical context. The ability of these algorithms to minimize
false positives can significantly contribute to reducing unnecessary
interventions or treatments for individuals who are not at risk, thereby optimizing
medical resources and patient care strategies. The success of these algorithms
in achieving high specificity can be attributed to their unique characteristics
and underlying mechanisms. Yu et al. [21], pointed out
that ANNs are adept at learning complex patterns and relationships within data
through interconnected layers of neurons. This ability enables them to identify
subtle patterns that may indicate the absence of osteoporosis, leading to
accurate predictions of negative cases.
Similarly, RF harnesses the power of ensemble learning by
combining multiple decision trees, which collectively make robust predictions [38]. This ensemble approach enhances RF's ability to
correctly classify negative cases by mitigating the impact of noisy data or
outlier influences. KNN relies on proximity-based classification, identifying
the class of a data point based on the classes of its neighboring data points [39]. This local decision-making process contributes to KNN's
high specificity, as it can effectively discriminate between different classes
within the dataset.
Furthermore, the article's emphasis on sample studies,
such as Shim et al. [39], and Thawnashom et al. [40], underlines the consistency of the findings across
different datasets. This not only adds credibility to the results but also
indicates the generalizability of ANN, RF, and KNN algorithms' high specificity
in diverse scenarios, reinforcing their potential as valuable tools in clinical
applications. In clinical practice, high specificity holds immense value.
Accurately identifying individuals without osteoporosis reduces unnecessary
stress, interventions, and treatments for those who do not require them. This
is particularly relevant in the context of osteoporosis, where overdiagnosis
and overtreatment can have negative consequences. The precision offered by ANN,
RF, and KNN algorithms can contribute to more targeted and efficient healthcare
strategies, ultimately leading to improved patient experiences and outcomes.
In essence, this study offers a comprehensive overview of
the predictive capacities of various machine learning algorithms in the domain
of osteoporosis. The identification of algorithms that excel in sensitivity and
specificity aspects underscores their potential for aiding clinicians in making
informed decisions and improving patient outcomes. As the first of its kind to
undertake a meta-analysis on this subject, this study not only expands our
understanding of the intersection of machine learning and osteoporosis but also
sets a precedent for future research endeavors seeking to harness the power of
data-driven approaches in medical prediction and diagnosis.
Study limitation
This review was subject to two limitations. Firstly, it
exclusively incorporated studies that had been published in the English
language, thus disregarding any research available in other languages. For a
more encompassing perspective, forthcoming studies should contemplate the
incorporation of articles published in languages other than English. Secondly,
the quest for pertinent studies was restricted to just three scientific
databases: Scopus, PubMed, and Web of Science. To achieve more thorough outcomes,
upcoming research should broaden their search scope to encompass a wider array
of databases.
Conclusion
In summary, our comprehensive review and meta-analysis
shed light on the remarkable potential of machine learning algorithms in
predicting osteoporosis. Specifically, ANN and SVM, RF, and KNN algorithms have
notably emerged as preeminent predictors, showcasing their robustness. The
amalgamation of diverse studies presents a compelling case for the efficacy of
these algorithms in proficiently recognizing individuals at risk of
osteoporosis.
This significant advancement not only offers the
potential for early interventions and enhanced results for patients but also
marks the beginning of a new era characterized by personalized and targeted
approaches for managing this incapacitating condition. Utilizing the potential
of machine learning, healthcare professionals have the opportunity to transform
the diagnosis and treatment of osteoporosis, leading to a fundamental change
that may ease the impact of the disease and provide a more optimistic outlook
for those facing it. The results of this meta-analysis establish a solid
groundwork for future research, emphasizing the importance of incorporating
machine learning methods into regular clinical procedures. This integration has
the potential to equip healthcare providers worldwide with powerful tools to
efficiently address osteoporosis.
Acknowledgement
The authors would like to express their gratitude to the
Central Library and Documentation Center of Kerman University of Medical
Sciences for providing access to the knowledge base references required for
this study.
Author’s contribution
KM and NN: Conceived the study design; KM, EM, and NN: Conducted
title/abstract and full-text screening; KM and NN: Performed the data
extraction; KM and NN: wrote the manuscript.
All authors contributed to the drafting the manuscript,
read and approved the final manuscript.
Conflicts of interest
The authors declare no conflicts of interest regarding
the publication of this study.
Ethical Approval
Not Applicable.
Financial disclosure
No financial interests related to the material of this
manuscript have been declared.
References
1.
Mirza F, Canalis E. Management of endocrine
disease: Secondary osteoporosis: Pathophysiology and management. Eur J
Endocrinol. 2015; 173(3): R131-51. PMID: 25971649 DOI: 10.1530/EJE-15-0118
[PubMed]
2.
Gulsahi A. Osteoporosis and jawbones in women. J
Int Soc Prev Community Dent. 2015; 5(4): 263-7. PMID: 26312225 DOI: 10.4103/2231-0762.161753
[PubMed]
3.
Cole ZA, Dennison EM, Cooper C. Osteoporosis
epidemiology update. Curr Rheumatol Rep. 2008; 10(2): 92-6. PMID: 18460262 DOI: 10.1007/s11926-008-0017-6 [PubMed]
4.
Sinaki M. Critical appraisal of physical
rehabilitation measures after osteoporotic vertebral fracture. Osteoporos Int.
2003; 14(9): 773-9. PMID: 12904834 DOI: 10.1007/s00198-003-1446-8
[PubMed]
5.
Miyakoshi N, Itoi E, Kobayashi M, Kodama H. Impact
of postural deformities and spinal mobility on quality of life in
postmenopausal osteoporosis. Osteoporos Int. 2003; 14(12): 1007-12. PMID: 14557854 DOI: 10.1007/s00198-003-1510-4 [PubMed]
6.
Sozen T, Ozısık L, Basaran NC. An
overview and management of osteoporosis. Eur J Rheumatol. 2017; 4(1): 46-56. PMID: 28293453 DOI: 10.5152/eurjrheum.2016.048 [PubMed]
7.
Lippuner K, Rimmer G, Stuck AK, Schwab P, Bock
O. Hospitalizations for major osteoporotic fractures in Switzerland: A
long-term trend analysis between 1998 and 2018. Osteoporos Int. 2022; 33(11): 2327-35.
PMID: 35916908 DOI: 10.1007/s00198-022-06481-0 [PubMed]
8.
Sukegawa S, Fujimura A, Taguchi A, Yamamoto N, Kitamura
A, Goto R, et al. Identification of osteoporosis using ensemble deep
learning model with panoramic radiographs and clinical covariates. Sci Rep.
2022; 12(1): 6088. PMID: 35413983 DOI: 10.1038/s41598-022-10150-x
[PubMed]
9.
Ponnusamy KE, Iyer S, Gupta G, Khanna A. Instrumentation
of the osteoporotic spine: Biomechanical and clinical considerations. Spine J.
2011; 11(1): 54-63. PMID: 21168099 DOI: 10.1016/j.spinee.2010.09.024
[PubMed]
10.
Dempster DW. Osteoporosis and the burden of
osteoporosis-related fractures. Am J Manag Care. 2011; 17(Suppl 6): S164-9.
PMID: 21761955 [PubMed]
11.
Tejaswini E, Vaishnavi P, Sunitha R. Detection and
prediction of osteoporosis using impulse response technique and artificial
neural network. International Conference on Advances in Computing,
Communications and Informatics. IEEE; 2016.
12.
Anam M, Ponnusamy V, Hussain M, Nadeem MW, Javed M,
Goh HG, et al. Osteoporosis prediction for trabecular bone using machine
learning: A review. Computers, Materials and Continua.
2020; 67(1): 89-105.
13.
De Vries BCS, Hegeman JH, Nijmeijer W, Geerdink J, Seifert
C, Groothuis-Oudshoorn CGM. Comparing three machine learning approaches to
design a risk assessment tool for future fractures: Predicting a subsequent
major osteoporotic fracture in fracture patients with osteopenia and
osteoporosis. Osteoporos Int. 2021; 32(3): 437-49. PMID: 33415373 DOI: 10.1007/s00198-020-05735-z
[PubMed]
14.
Shim J-G, Kim DW, Ryu K-H, Cho EA, Ahn JH, Kim
JI, et al. Application of machine learning approaches for osteoporosis risk
prediction in postmenopausal women. Arch Osteoporos. 2020; 15(1): 169. PMID: 33097976 DOI: 10.1007/s11657-020-00802-8 [PubMed]
15.
Moons KGM, Wolff RF, Riley RD, Whiting PF, Westwood
M, Collins GS, et al. PROBAST: A tool to assess the risk of bias and
applicability of prediction model studies. Ann Intern Med. 2019; 170(1): W1-33.
PMID: 30596876 DOI: 10.7326/M18-1377 [PubMed]
16.
Ordonez C, Matias JM, Juez JFD, Garcia PJ. Machine
learning techniques applied to the determination of osteoporosis incidence in
post-menopausal women. Mathematical and Computer Modelling. 2009; 50: 673-9.
17.
Anastassopoulos G, Adamopoulos A, Galiatsatos D, Drosos
G. Osteoporosis risk factor estimation using artificial neural networks and
genetic algorithms. Stud Health Technol Inform. 2013: 190: 186-8. PMID:
23823417 [PubMed]
18.
Chang HW, Chiu YH, Kao HY, Yang CH, Ho WH. Comparison
of classification algorithms with wrapper-based feature selection for
predicting osteoporosis outcome based on genetic factors in a Taiwanese women
population. Int J Endocrinol. 2013; 2013: 850735. PMID: 23401685 DOI: 10.1155/2013/850735
[PubMed]
19.
Kim SK, Yoo TK, Oh E, Kim DW. Osteoporosis risk
prediction using machine learning and conventional methods. Annu Int Conf IEEE
Eng Med Biol Soc. 2013; 2013: 188-91. PMID: 24109656 DOI: 10.1109/EMBC.2013.6609469
[PubMed]
20.
Yoo TK, Kim SK, Kim DW, Choi JY, Lee WH, Oh
E, et al. Osteoporosis risk prediction for bone mineral density assessment of
postmenopausal women using machine learning. Yonsei Med J. 2013; 54(6): 1321-30.
PMID: 24142634 DOI: 10.3349/ymj.2013.54.6.1321 [PubMed]
21.
Yu XH, Ye C, Xiang L. Application of artificial
neural network in the diagnostic system of osteoporosis. Neurocomputing. 2016;
214: 376-81.
22.
Meng J, Sun N, Chen YL, Li Z, Cui X, Fan
J, et al. Artificial neural network optimizes self-examination of osteoporosis
risk in women. J Int Med Res. 2019; 47(7): 3088-98. PMID: 31179797 DOI: 10.1177/0300060519850648
[PubMed]
23.
Yang WYO, Lai CC, Tsou MT, Hwang LC. Development of
machine learning models for prediction of osteoporosis from clinical health examination
data. Int J Environ Res Public Health. 2021; 18(14): 7635. PMID: 34300086 DOI: 10.3390/ijerph18147635 [PubMed]
24.
Wang YQ, Wang LX, Sun YL, Wu M, Ma Y, Yang
L, et al. Prediction model for the risk of osteoporosis incorporating factors
of disease history and living habits in physical examination of population in
Chongqing, Southwest China: Based on artificial neural network. BMC Public
Health. 2021; 21(1): 991. PMID: 34039329 DOI: 10.1186/s12889-021-11002-5
[PubMed]
25.
Lim HK, Ha HI, Park SY, Han J. Prediction of
femoral osteoporosis using machine-learning analysis with radiomics features
and abdomen-pelvic CT: A retrospective single center preliminary study. PLoS
One. 2021; 16(3): e0247330. PMID: 33661911 DOI: 10.1371/journal.pone.0247330
[PubMed]
26.
Klontzas ME, Manikis GC, Nikiforaki K, Vassalou EE, Spanakis
K, Stathis I, et al. Radiomics and machine learning can differentiate transient
osteoporosis from avascular necrosis of the hip. Diagnostics (Basel). 2021; 11(9):
1686. PMID: 34574027 DOI: 10.3390/diagnostics11091686 [PubMed]
27.
Patil KA, Prashanth KVM, Ramalingaiah A.
Classification of osteoporosis in the lumbar vertebrae using L2 regularized neural
network based on PHOG features. International Journal of Advanced Computer
Science and Applications. 2022; 13(4): 413-23.
28.
Huang CB, Hu JS, Tan K, Zhang W, Xu TH, Yang
L. Application of machine learning model to predict osteoporosis based on
abdominal computed tomography images of the psoas muscle: A retrospective
study. BMC Geriatr. 2022; 22(1): 796. PMID: 36229793 DOI: 10.1186/s12877-022-03502-9
[PubMed]
29.
Zeitlin J, Parides MK, Lane JM, Russell LA, Kunze
KN. A clinical prediction model for 10-year risk of self-reported osteoporosis
diagnosis in pre- and perimenopausal women. Arch Osteoporos. 2023; 18(1): 78. PMID: 37273115 DOI: 10.1007/s11657-023-01292-0 [PubMed]
30.
Wu X, Zhai F, Chang A, Wei J, Guo Y, Zhang
J. Application of machine learning algorithms to predict osteoporosis in
postmenopausal women with type 2 diabetes mellitus. J Endocrinol Invest. 2023; 46(12):
2535-46. PMID: 37171784 DOI: 10.1007/s40618-023-02109-0
[PubMed]
31.
Sebro R, Elmahdy M. Machine learning for opportunistic
screening for osteoporosis and osteopenia using knee CT scans. Can Assoc Radiol
J. 2023; 74(4): 676-87. PMID: 36960893 DOI: 10.1177/08465371231164743
[PubMed]
32.
Lin Y-T, Chu C-Y, Hung K-S, Lu C-H, Bednarczyk
EM, Chen H-Y. Can machine learning predict pharmacotherapy outcomes? An
application study in osteoporosis. Comput Methods Programs Biomed. 2022; 225: 107028.
PMID: 35930862 DOI: 10.1016/j.cmpb.2022.107028 [PubMed]
33.
Fasihi L, Tartibian B, Eslami R, Fasihi H.
Artificial intelligence used to diagnose osteoporosis from risk factors in
clinical data and proposing sports protocols. Sci Rep. 2022; 12(1): 18330. PMID: 36316387 DOI: 10.1038/s41598-022-23184-y [PubMed]
34.
Maroco J, Silva D, Rodrigues A, Guerreiro M, Santana
I, de Mendonca A. Data mining methods in the prediction of Dementia: A
real-data comparison of the accuracy, sensitivity and specificity of linear
discriminant analysis, logistic regression, neural networks, support vector
machines, classification trees and random forests. BMC Res Notes. 2011; 4: 299.
PMID: 21849043 DOI: 10.1186/1756-0500-4-299 [PubMed]
35.
Yao Y, Liu Y, Yu Y, Xu H, Lv W, Li Z, et al. K-SVM:
An effective SVM algorithm based on K-means clustering. Journal of Computers.
2013; 8(10): 2632-9.
36.
Qiu X, Zhang L, Suganthan PN, Amaratunga GAJ.
Oblique random forest ensemble via least square estimation for time series
forecasting. Information Sciences. 2017; 420:
249-62.
37.
Javaid M, Haleem A, Singh RP, Suman R, Rab S. Significance
of machine learning in healthcare: Features, pillars and applications. International Journal of Intelligent Networks. 2022;
3: 58-73.
38.
Belgiu M, Dragut L. Random forest in remote
sensing: A review of applications and future directions. ISPRS Journal of Photogrammetry and Remote Sensing. 2016;
114: 24-31.
39.
Saputra M, Mawengkang H, Nababan E. Gini index with
local mean based for determining k value in k-nearest neighbor classification.
Journal of Physics: Conference Series. 2019; 1235: 012006.
40.
Thawnashom K, Pornsawad P, Makond B. Machine
learning's performance in classifying postmenopausal osteoporosis Thai
patients. Intelligence-Based Medicine. 2023; 7:
100099.